Last week thousands of people participated in the very American tradition of attending Major League Baseball’s Opening Day. If you love numbers as much as we do, baseball is your sport — the pace and structure of the game provide statistics for endless analyses.
Since professional sports stats tend to be a bit more exciting than listener stats, indulge us for a moment as we examine the “batting averages” of podcast genres in the U.S.
We are following up on our recent genre rankers to take a look at the 200 biggest shows to see what genres are best represented at the top. As a refresher, Edison Podcast Metrics is the only data source covering the entire podcasting space, so when you see rankers of the biggest shows, it is allthe shows. Several weeks ago, we put out the biggest shows overall here.
We divided the number of shows in the top 200 into the total number of shows coded to that genre in our code list, to determine the representation at the top – creating a “batting average” of sorts.Baseball batting averages are calculated by dividing the number of hits into the number of atbats; this podcast genre “batting average” is calculated by looking at the number of times a genre appears in the top 200 (its hits) divided by the number of times a genre appeared in the top 20,000 (its at-bats).
Podcast averages are ‘low’ compared to baseball, and this is because there are so many more podcasts. In other words, if we look at the top one percent of shows, an equal distribution would mean that 1% of the titles in that category should be in the top 200. So, we can think of a podcast batting average of 1% as being equivalent to your typical major league batter – say a .250 hitter. As we go above 1%, we are looking at the podcast genres with the highest batting averages.
As such, a clear story emerges.
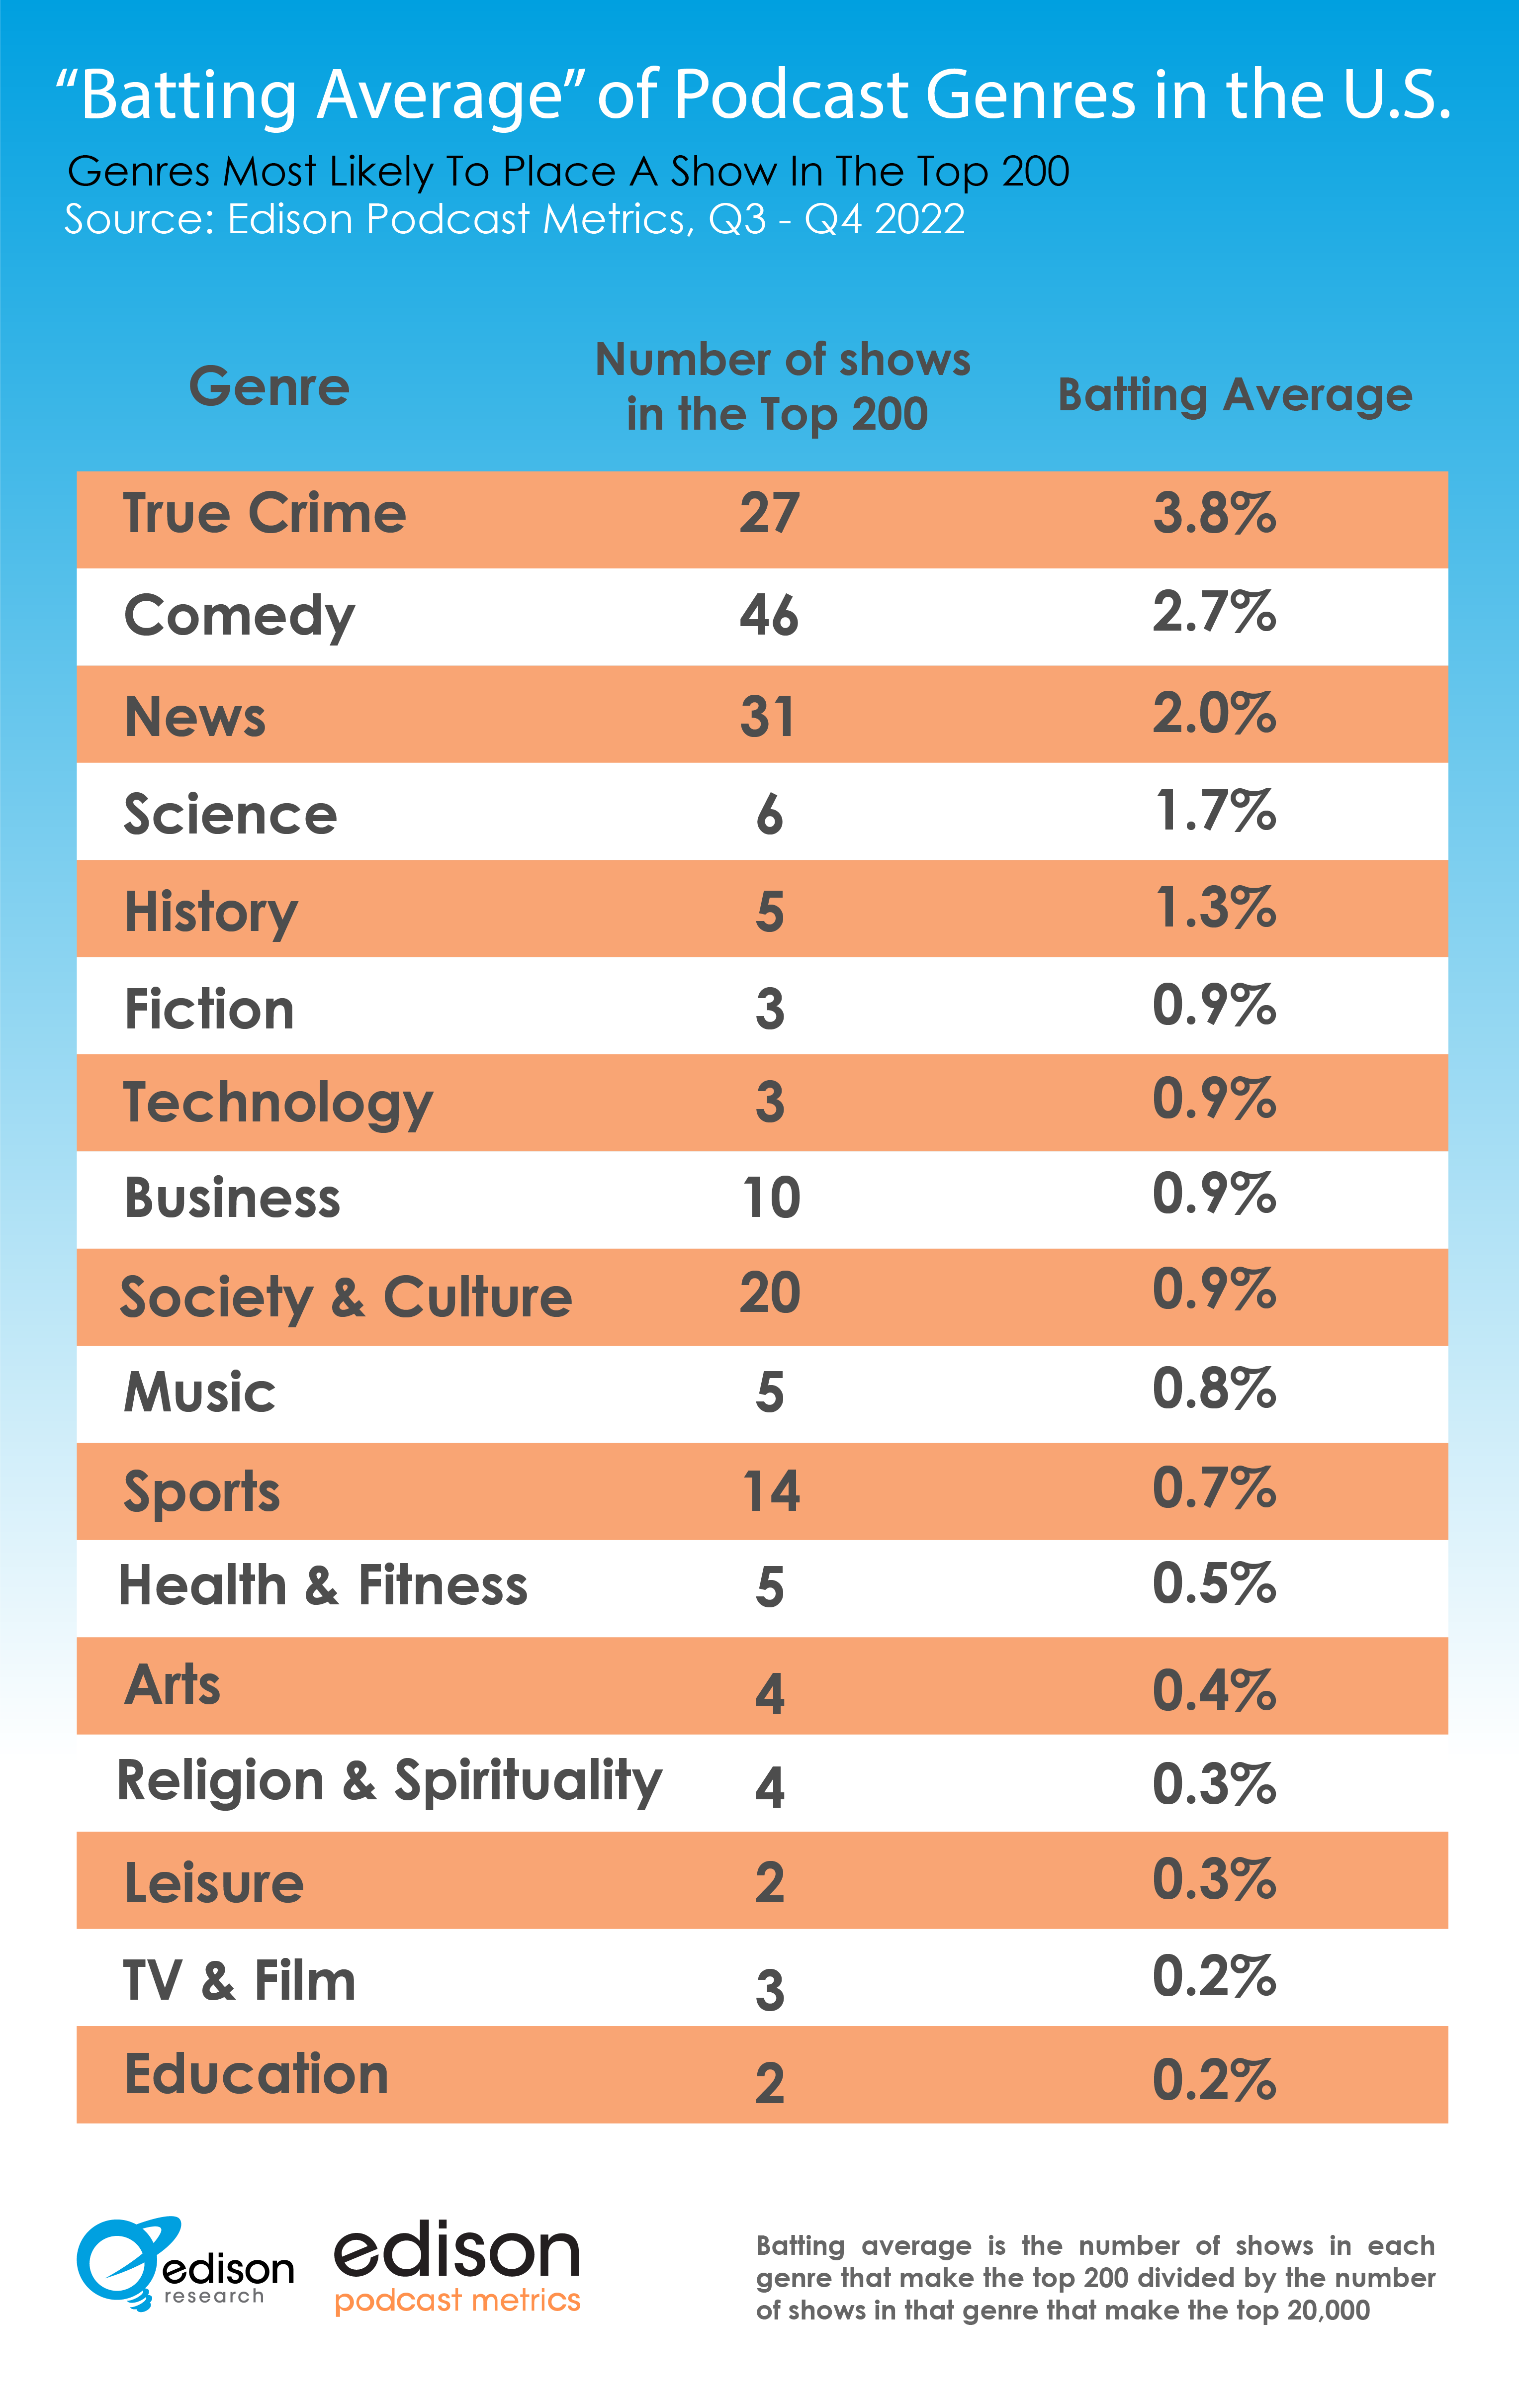
While it doesn’t have the most shows in the top 200, True Crime scores an easy win for the batting title. Fully 3.8% of all the shows coded to True Crime (among the top 20,000 shows in our code list) make the top 200.
Comedy has more shows in the top 200, but way more shows overall, so it checks in at second place with a 2.7% average.
And the third best batting average is for News with 2.0%. The other genres with an above-par average are Science and History.
This is not to say that the only path to the top is to be in these categories. Note that the grab-bag category of “Society & Culture” has 20 shows in the top 200. It is just that there are so many shows in this category in the top 20,000 that its average is below 1%.
Note further that every category has at least a few shows in the top 200. But if one is looking at these ‘batting averages’, True Crime is the genre that yields the highest chance for a ‘hit’.