Company News · November 8, 2010
Visualizing The Exit Polls
By Tom Webster
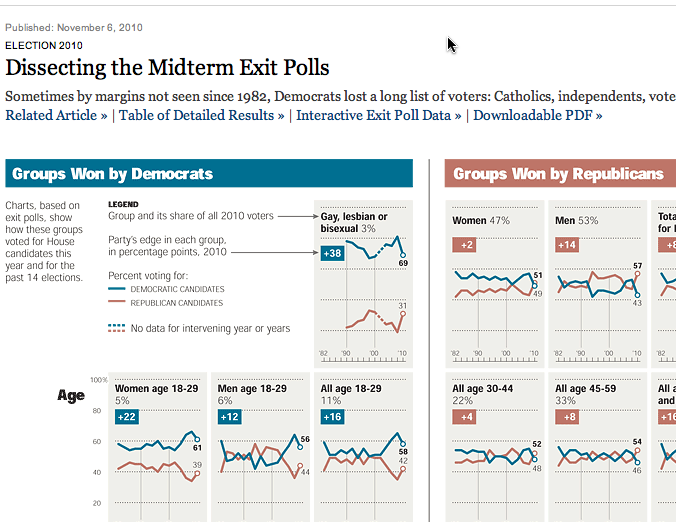
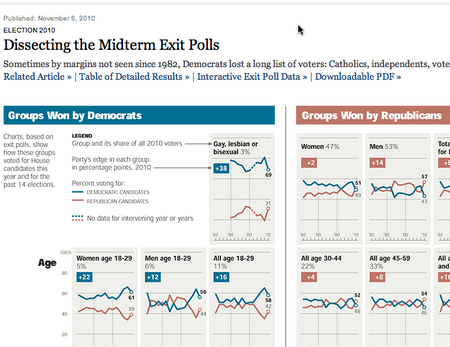
Our clients at the New York Times have done their usual bang-up job creating infographics of our exit poll data. For a clear, one-page overview of how various groups voted in last Tuesday’s National Election, this piece, “Dissecting the Midterm Exit Polls” is a concise summary of not only the 2010 elections, but how these various demographic groups have voted since 1982.
Get our latest insights delivered to your inbox.
Our clients at the New York Times have done their usual bang-up job creating infographics of our exit poll data. For a clear, one-page overview of how various groups voted in last Tuesday’s National Election, this piece, “Dissecting the Midterm Exit Polls” is a concise summary of not only the 2010 elections, but how these various demographic groups have voted since 1982.